среда, 23 марта 2011 г.

Update SA to version 6.2.4.4

 
SA update to the version v 6.2.4.4 

We continue to increase SA power and abilities, we expand possibilities of OFDM module of the analyzer in this update.
 

1. In display of OFDM signal spectrum  small pedestal/platform in 10 pixels is added. It allows to see all line of channels current/investigated LU.

2. Possibility to display on phase planes only every second, the third etc. symbols  is added.

3. Possibility to shift/replace a start point is added during dynamic mapping. In a combination with the previous element, it allows to find out/study rather effectively various special channels/symbols in signals.
As an example there is one service channel of signal WinDrm is shown below.


For comparing it is shown as it looks/looked in old versions.


Important! The second and third points of updates, work only in a dynamic mode!

This update considerably expands analysis OFDM  signals, bringing it on qualitatively higher level.

Small manual on the technician of OFDM analysis  by means of current version SA are described in the article the Overview article (manual) about  the analysis of various OFDM signals in SA versions v 6.2.4.4

Good luck.

пятница, 4 марта 2011 г.

Examples of using MFSK demodulator in SA v 6.2.4.2

 Examples of using MFSK demodulator in SA v 6.2.4.2 


In this article, we will consider examples of usage of universal MFSK demodulator in SA version v 6.2.4.2 


Practically, any FSK/MFSK signal can be demodulated to a bit-stream in SA last versions. Here is, when we say "any" we mean, that there is nothing known about a signal initially. Also it is meant that necessity for obtaining/getting of the bit-stream can arise at any moment, on any signal, or any part of a signal. 


The Example. The record of an unknown system in a VHW band ~900 mHz. 


Step by step guide of main actions is shown below: 

Step 1. Select a necessary/interesting fragment of the signal and create a copy. 

Step 2. Select a necessary/interesting band of the signal and move it in a bottom. 

Step 3. The Main objective of the previous step is the reduction of sampling rate to an optimal value. Initial record has sampling rate 68 mHz, and it has sampling rate for the signal, which is interesting us with the full spectrum in ~ 180-190 kHz is absolutely superfluous. 

The mechanism of the abstract frequency conversion of sampling rate is built in SA, that is to us it doesn't matter which sampling rate will be specific, it is important that it would be optimal. It works as follows, and we had already wrote about it in one of updates. 


In the same way works the abstract shift of a signal by frequency. It is also doesn't matter to us which position the signal occupies, but it is important that it would be in optimal position by frequency on sonogram. 

Let’s come back to the signal. 

The full version of this guide-article you may read here.

понедельник, 28 февраля 2011 г.

Update SA to the version v 6.2.4.2

Update SA to the version v 6.2.4.2

In this update the range of problems found out by users has been solved.


1. The rigid/hard restriction on data size for calculation ACF and CCF is introduced.
 
The matter is that due various reasons, at the call of ACF and CCF functions SA user can casually push "Ok" in a situation, when the user hadn't supposed to do it, or the user wanted to push "Cancel" instead "Ok", and the hand itself has pushed other button. :)
 
In this version such situations are eliminated. The maximum data size for operation of function ACF makes 70 mbytes. For CCF, the maximum size of a fragment is about 50 mbytes. If these restrictions for someone are essential, please inform us about it (e-mail us), and we will solve this question.


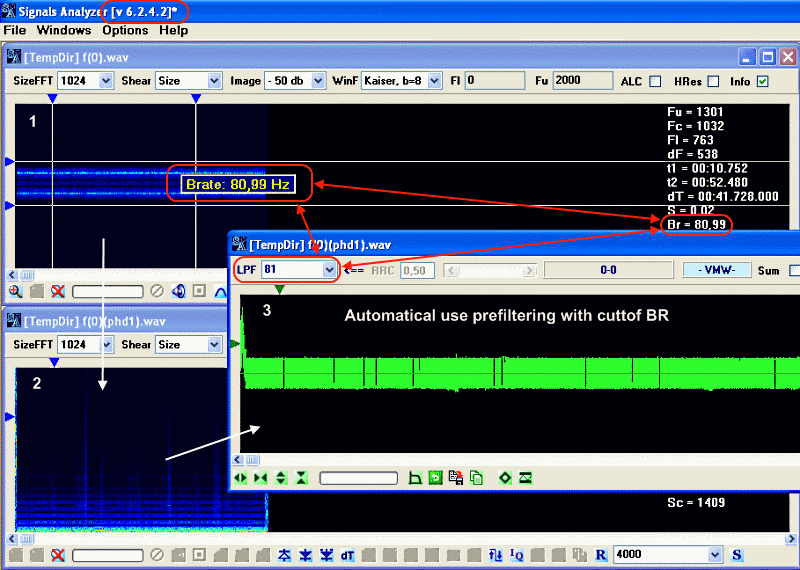
2. Very often, after the phase detector, the call of signals waveform module follows. In this version, if beforehand the value of clock frequency has been recieved by SA tools, then LPF filter is applied at once by default. Normally, in 99 % of cases, this is the standard action, which is just automated now.


As usual, except the described changes, a range of hardly noticeable, but important moments is fixed.


Good Luck!

воскресенье, 20 февраля 2011 г.

SA update to version v 6.2.3.8: Universal MFSK demodulator

SA update to version v 6.2.3.8

In this update, the pilot version of the general-purpose/universal demodulator MFSK is realized.


The demodulator supports to 256 levels (frequencies) of various MFSK signals. As an example: obtaining of a bit stream from the records Packet AX.25 and APCO-25 it is shown on the picture above. As FSK-2 it is special case of MFSK, the current extension of the module doesn't influence the previous possibilities, but only expands them.


Please pay attention on the allocation of levels of demodulation. The first and last levels, aren't restricted by the markers! Their area is stretched behind their limits, as it is shown below.


The bit stream can be presented in two variants.

The first variant is the symbol representation of levels recoded by default. In this case, the internal map of codings is used. 32 characters are supported standardly. It is favourable for using for FSK-2, MFSK-4,8,16 etc., that is, for rather few-channeled MFSK modes.

The second - obtaining/recieveing of the stream in the form of HEX-byte. Bytes in this case are partitioned/devided by the symbol-separator "x" (the Latin character "X" on the lower register).


As, the bit stream implies further processing anyway, we have refused an inverse mode. There is no big sense in an inverse mode, as an inverse can be received in any exterior viewer. Besides, we are planning to create our own special viewer of a bit streams.

Below you may view the practical example of operation of general-purpose/universal MFSK demodulator on the signal South African Navy.


Good luck!

вторник, 15 февраля 2011 г.

OFDM, COFDM: CIS-128

CIS-128
Br~21, Sh~23.5, Ch-128 in use, total 129 - 1 as gap/off/skiped
OFDM, COFDM


Author: SergUA6
Band Width ~3000-3100 Hz
Low Range 470-500 Hz
Baud Rate ~21 Hz
n-Ary (PSK/MPSK) Mixed mode QAM-16 and PSK
Count of Carriers 129 - 1
Step between carriers ~23.5 Hz
ACF ~476-477 ms
RX mode SSB


Sonograms:

pic.1 General view

pic.2 Clock frequency of manipulation (classical method of recieveing)


Diagrams:
pic.3 The signal's detalization in OFDM module

pic.4 Detalization of the signal if OFDM module


pic.5 Detalization of the signal if OFDM module


Pictures:

pic.6 ACF of the signal

pic.7 CCF of two adjacent fragments with duration 250 ms


CIS-128 - is an interesting enough signal, though quality of the record is not so high. Nevertheless, rather easily it is possible to receive all main parameters in module OFDM. It is shown on the pictures.

It is very interesting that there is divergence ACF with a real state of affairs. ACF shows that there is a periodicity in 10 symbols in the signal. The detailed analysis in module OFDM allows to find out that every fifth symbol is specia l(synchro), and it is logical to expect, that ACF will be with the same period, but it is not so. This moment is easily specified with usage of CCF function. As it is shown on rice 7.

It is well visible that every fifth symbol special (synchro), but special (synchro) symbols different, and alternate through one. It also shows ACF as in this case the repetition period is really equal to 10 symbols.

CCF allows to receive more fine and exact structure, where it is displayed both the general period of special (synchro) symbols, which is equal 5 symbols (steps), and the period of separately even and odd symbols, which is equal already to 10 steps.

One more feature of this record which is well visible in dynamics - is the intensive use of modulation QAM-16 in the first half of the signal, and episodical/rare in the second part of the signal.

суббота, 12 февраля 2011 г.

SA update to version v 6.2.3.6

SA update to version v 6.2.3.6

We have added a cross-correlation function (Cross-Correlation Funсtion- CCF) in this update.

In a difference from ACF, CCF function, in some cases, can provide more information about a signal or the selected fragment.


After CCF launching, the cross correlation of the selected fragment of a signal between V-markers and whole record is calculated. It is shown typical on the picture, and it is certainly far not just one example of CCF usage.

As it is not difficult to notice, the selected fragment, enters as a component into all units of the signal on the record, and the position of this part is precisely defined on peaks of CCF resmult. The maximum peak will correspond to position of an initial fragment, as correlation in this case is 100 %. It is problematic enough to find out this singularity by other methods.

As usual, some bugs, which has been found out by users are eliminated, a range of internal functional improvings is realized.

Good luck.

четверг, 13 января 2011 г.

Updating SA to the version v 6.2.3.4

Updating SA to the version v 6.2.3.4


Users find out two problems.


The first problem. Sometimes, at the call of WF viewer, in the opened window, the part of a nonexistent fragment of the signal is displayed, usually, in the end.


The second. After registration is done. At the start of already registered version, the registration window keep constantly appear at each program opening.


Both problems were being happen rare enough. The last problem, in general, had been found out only in one case.


Nevertheless, if the user will be sending the detailed, step-by-step mechanism of occurrence/occurrence of the problem, chances of the fast and successful decision are rather great.


In this update we have removed these two errors, and we have added the new abilty into SA palette of tools.


The ability to obtain/get the first derivative of any signal, which is loaded in SA, have being added. The competent combination of this possibility with other tools, in some cases, expands the analysis, allowing to receive considerably better results.


There is the example on the picture, which shows an application of the first derivative, for obtaining more accurate and clear ACF picture, after quadrature detector.

The first derivative in DSP, at the general case/image, is approximated well enough by a difference of the adjacent samples of the signal.

As a whole, the first derivative can be interpreted as UPF with the special characteristic. Repeated application of this function is equivalent to obtaining of high-order derivative. I have to notice, that in practice it is extremely rare occurences, as already the first derivative received by method of multiply function application, in strict mathematical sense is not fully correct.

The signal-envelope sometimes is very informative by itself, but presence of a constant component frequently masks/hides various features. Using of the first derivative of the signal's envelope as the material for analysis, can strongly help in such cases. As it is shown on the example.

Good Luck~