SA update to version v 6.2.5.0/1
Planned SA update.
Determination of an exact amount of frequencies in the various MFSK signals is an important enough task in the analysis. In this update we had added this possibility, we introduced function "Count freqs” into the module of viewer of the form(WF).
The function "Count freqs" calculations of the size of the grid of frequencies. I underline, not an amount of frequencies used/involved in a current fragment of a signal, but dimensionality of the grid, in which limits these frequencies are generated.
Basic actions on function "Count freqs" usage are the following:
1. To receive speed of manipulation of the signal - Baud rate, by any method. It is desirable, but not a mandatory step.
2. To select the signal by H-markers. This operation demands an accuracy. It is impossible to select the signal too densely, and it is impossible to select it too widely, the reasonable compromise is required. Normally we recommend to allocate the markers on distance within (1.5-3) *Br from the signal.
3. Call the Phase detector function. It is the standard operation, which creates the new window with results.
4. It is necessary to call WF module in the new window through PopUp menu, it is also the standard action. If in the first point value Baud rate has been received, in WF module, then the automatic filtration of the signal will be produced, otherwise the filtration will be necessary to realize in the manual mode.
5. It is necessary that all artifacts (usually it is the beginning and the end of a signal) have been displayed behind the display window in WF module. It is possible to reach, at least by two methods:
The first - to select a pure part of the signal with V-markers, and to create a copy in the new window.
The second - using horizontal zoom, and shifting/moving the signal by the horizontal slider, to bring in the artefacts behind the window borders.
6. To turn on the mapping of the histogram "Sum"=ON on the "pure" signal. To pick up the size of the histogram by vertical. To install H-markers on the upper and lower channel of the histogram. To cause PopUp menu of the module. Position of V-markers can be any as all visible part of the signal is processed.
7. To select point "Count freqs".
Important! The result of function "Count freqs" is not an amount of channels in the signal, but the size of the uniform/proportional grid of frequencies, in which the used channels are "laid down". The so-called grid of formation, the size of this grid represents big interest in the analysis.
Range of determination of dimensionality of the grid of frequencies by the function "Count freqs", is from 4 to approximately 260. In reality, the function defines grids of more dimensionalities to 300-320, but it very strongly depends on the signal quality, and many other things.
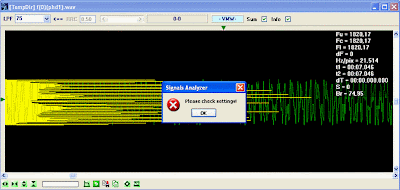
Error report appearance is possible.
The reasons/causes:
- Both H-markers, and-or one of them, are installed not on the histogram lines/channels
- There are lesser then 4 or more then 400 frequencies in the signal
- The distance between H-markers is too small, or the markers are combined
- the function can't be completed correctly at current parameters of the signal, or on the current fragment of the signal.
There is an article on usage of this new function, as there are some thin moments and nuances, which are beyond the update description => Signals Analysis in SA version v 6.2.5.1
It is necessary to show certain care, although function "Count freqs" works reliably enough in many cases, nevertheless, it is rigid enough algorithm which can be mistaken.
As usual, minor problems found out by users are removed. Also I want to express gratitude to all beta testers, who have taken part in preliminary testing of this update.
Good Luck~
Where are the logs?!
-
Regular blog visitors know the logs that used to show up at this place. Due
to changing to a different server (thanks to UCIS Internet & BitZo in
Breda, NL...
13 лет назад


